May 13, 2019

Customer churn, also known as “customer turnover” is defined as the loss of clients or customers. In the Telecoms world, we define this as a subscriber dropping your service. Customer retention is much cheaper than customer acquisition. So being able to predict when and why a customer will churn is crucial to a company’s survival.In the following example, we’re going to use the Nigeria Telecoms Churn competition data from Kaggle to see how close we can get at predicting customer churn.
Setup
Dependencies
We’ll import the following libraries:
pandas – to handle our data manipulation.
numpy – to work with vectors and matrices.
xgboost – provides the XGBoost machine learning algorithm.
If you’re using Python 3 enter the following commands to download the packages.
Next import these packages into the code.

Configurations
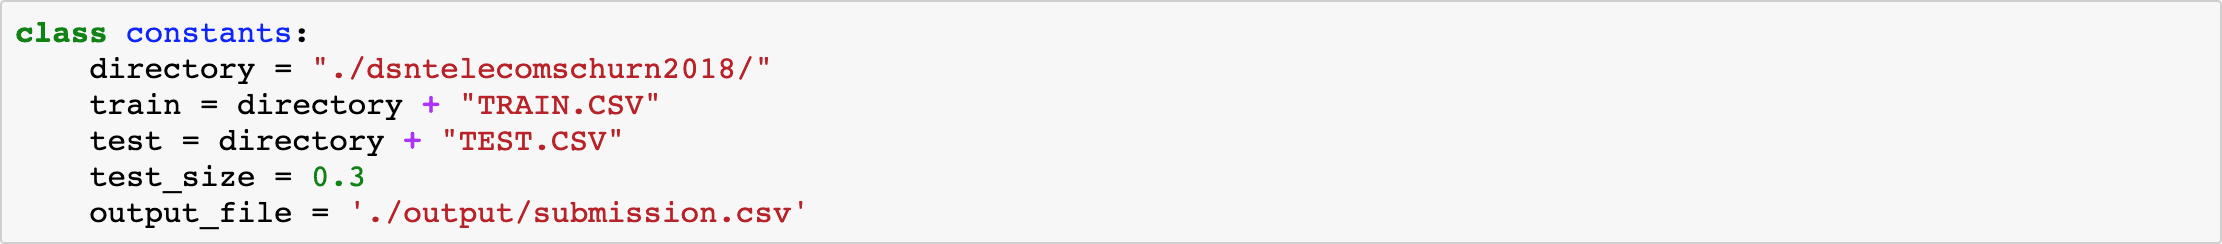
The training and testing data are available on the Kaggle page. Run this code locally, and make sure that you are pointing to the correct directories on your machine.
Inspect the Data
Load the training dataset into a Pandas Dataframe and view the first 5 rows of the table.
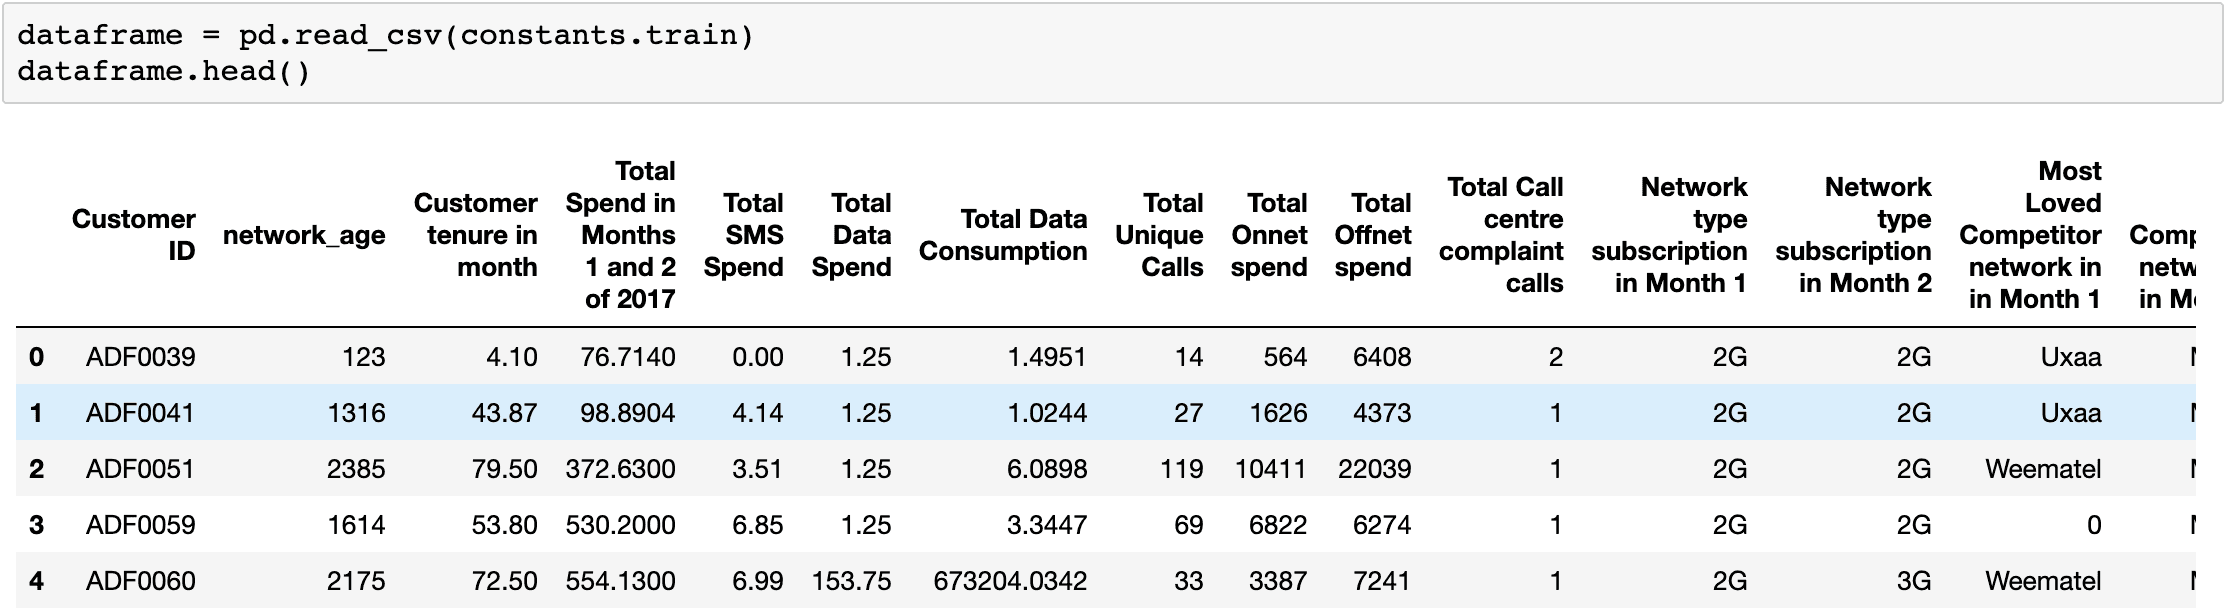
Each customer has many associated features. The last column, labeled “Churn Status,” represents whether the customer has left in the last month.
The kaggle competition page gives us an explanation of each of the columns or features.
Total Spend in Months 1 and 2 of 2017: The total spend of a customer in the months July & August 2017.
Total SMS Spend: The total spend on SMS by a customer revenue earned through the SMS service used by the subscriber.
Total Data Spend: The total amount spend on Data/Internet by a customer revenue earned through the SMS service used by the subscriber.
Total Data Consumption: The total data consumed by a subscriber in KB over the period under study
Total Unique Calls: The total count of unique calls made by a subscriber during the period under review
Total Onnet spend: The total spend of a customer to make on-network calls (on the same network as the subscriber)
Total Offnet spend: Aggregate of Off Net Revenue: The total spend of a customer to make off-network calls (not the same network as the subscriber)
Customer Tenure in Months: The time passed since the subscriber started using the services of the network provider and counted in months
Network type subscription in Month 1: This indicates preferred network subscription of a customer, which may indicate their type of device – 2G or 3G service.
Network type subscription in Month 2: This indicates preferred network subscription of a customer, which may indicate their type of device – 2G or 3G service in the month after.
Total Call centre complaint calls: The number of complaints made by the subscribers.
Most Loved Competitor network in in Month 1: This information certainly have a huge impact on as it gives the information about which other service provider prefer and may likely move to
Most Loved Competitor network in in Month 2: This information certainly have a huge impact on as it gives the information about which other service provider prefer and may likely move to
Churn Status: This is an indicator of a customer who leaves the network or not. 1 means the customer has churned and 0 means no churn.We can use the XGBoost algorithm to take in our set of features as an input, and hopefully learn to predict the Churn Status effectively.
Data Preprocessing
XGBoost, as well as and most machine learning models, require all of the inputs to be numeric. We need to do something with the following categorical features:
Network type subscription in Month 1
Network type subscription in Month 2
Most Loved Competitor network in in Month 1
Most Loved Competitor network in in Month 2
The unique values for each feature do not hold an ordinal relationship, so we will apply a one-hot encoding to these features. We also need to do something about the missing values.
Data Imputation
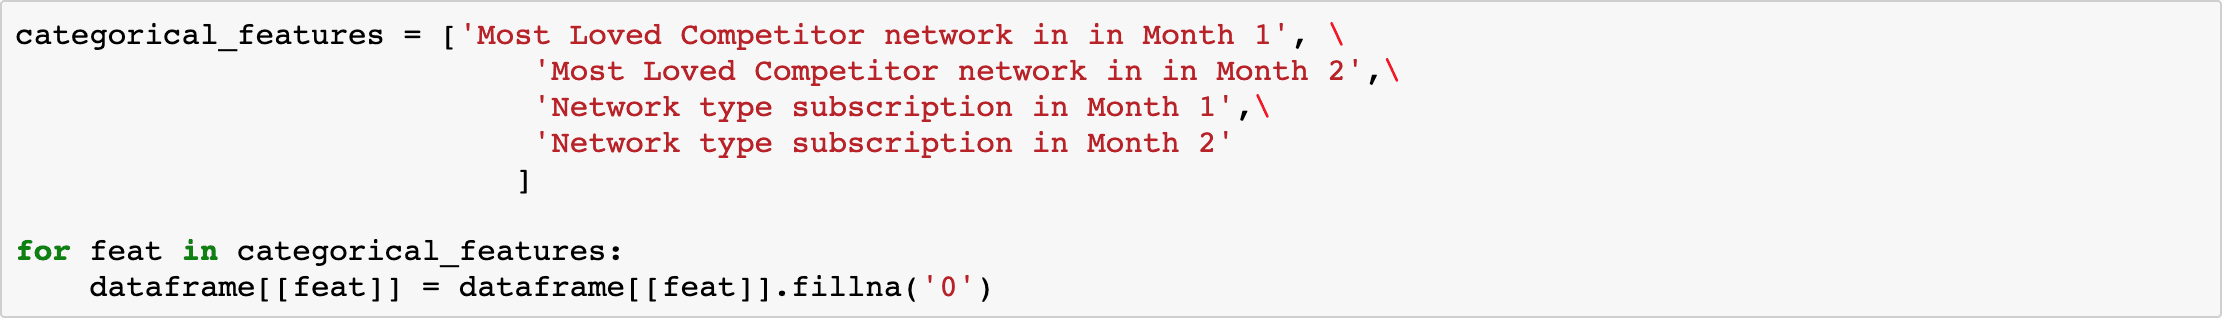
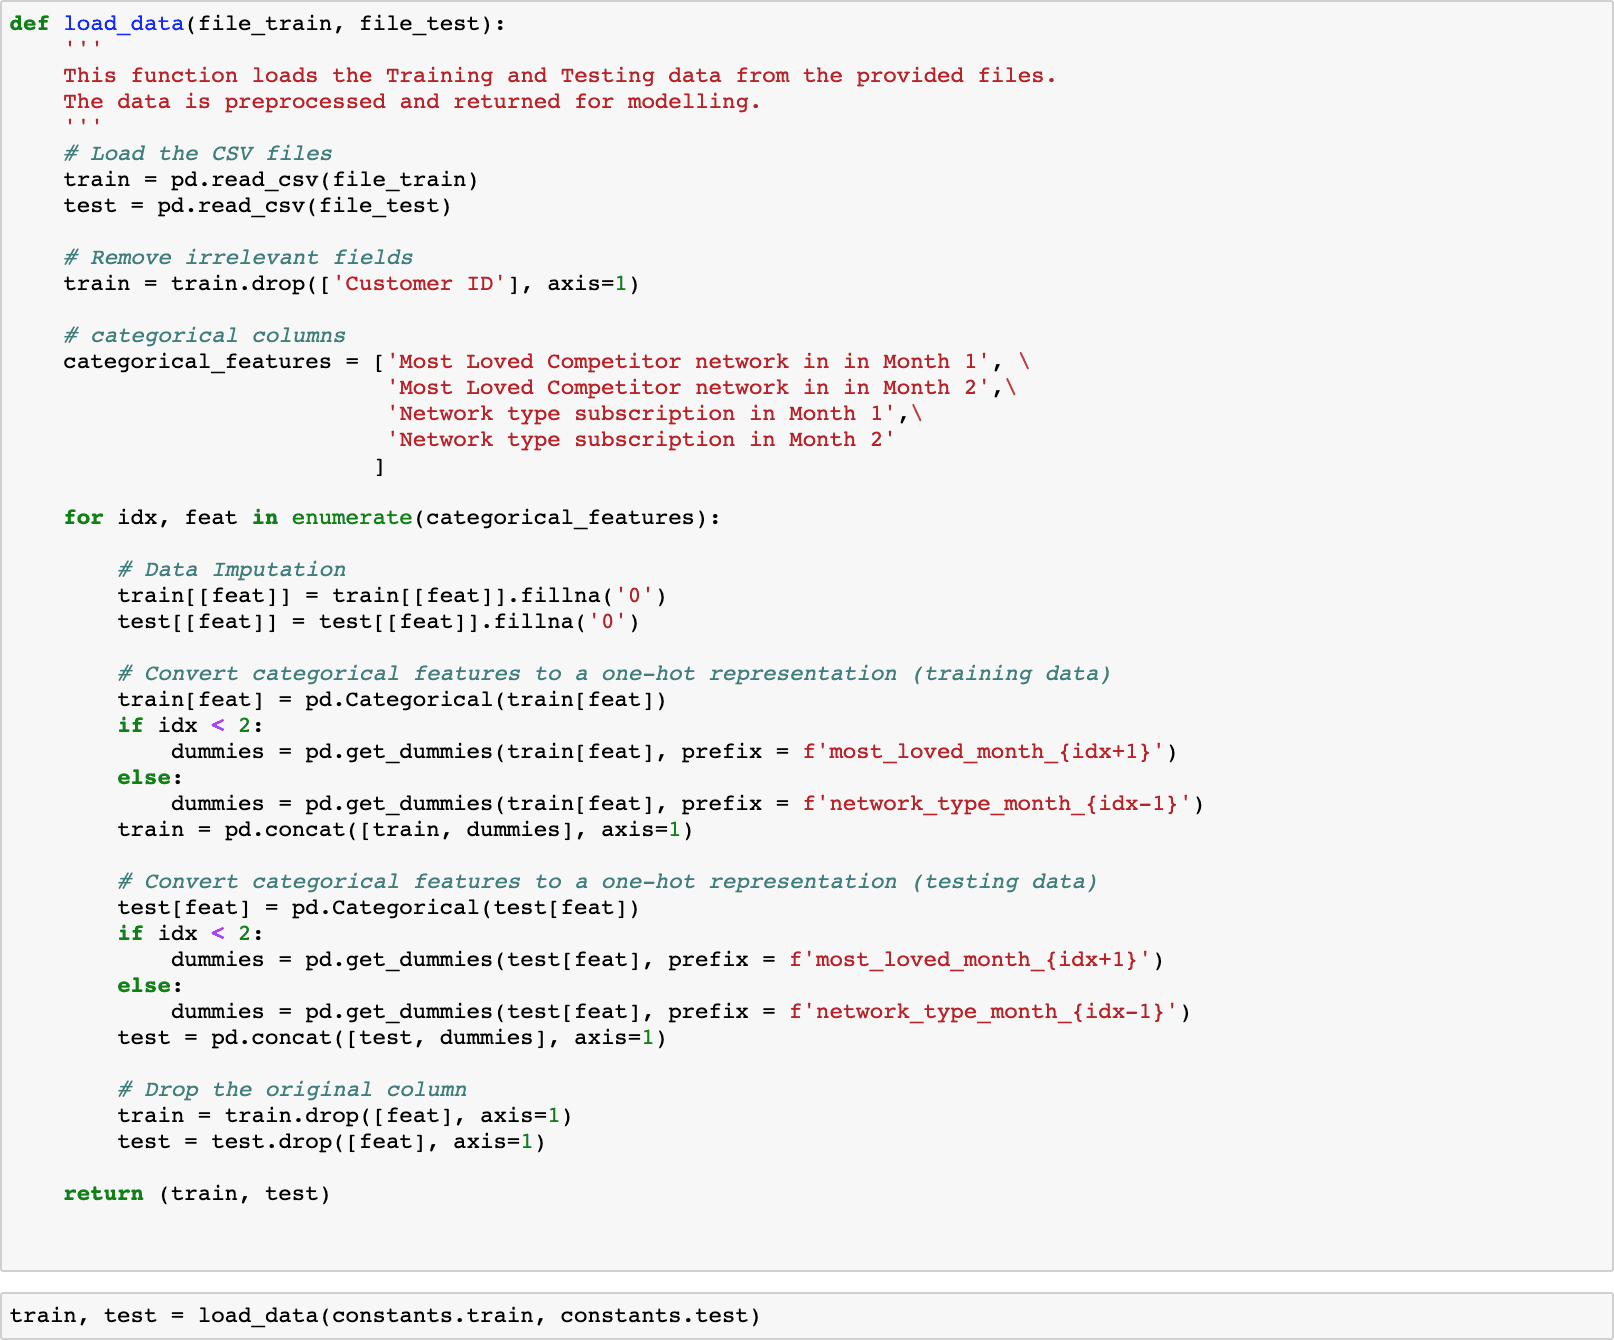
Data Imputation is the process of replacing missing data with substituted values. You can do this in a number of ways such as using the mean, median, mode, standard deviation, all zeros, etc. In this case, we just fill it with all zeros.
Note: We use the character ‘0’ and not the value 0 here because in our next step, we need all of the values to be in a string format.
Discretize categorical data
In this next step, we will turn our 4 categorical features into 22 binary features using one-hot encoding. For example, our “Most Loved Competitor” columns have 7 unique values, “Mango”, “PQza”, “ToCall”, “Uxaa, “Weematel”, “Zintel”, and “0”. One-hot encoding turns these values into a numeric value (0 through 6), and then converts that to the one-hot representation with the following possible values:
[1,0,0,0,0,0,0] -> "Mango"[0,1,0,0,0,0,0] -> "PQza"[0,0,1,0,0,0,0] -> "ToCall"[0,0,0,1,0,0,0] -> "Uxaa"[0,0,0,0,1,0,0] -> "Weematel"[0,0,0,0,0,1,0] -> "Zintel"[0,0,0,0,0,0,1] -> "0"
We can now represent each element in these arrays as a separate column in our pandas dataframe.
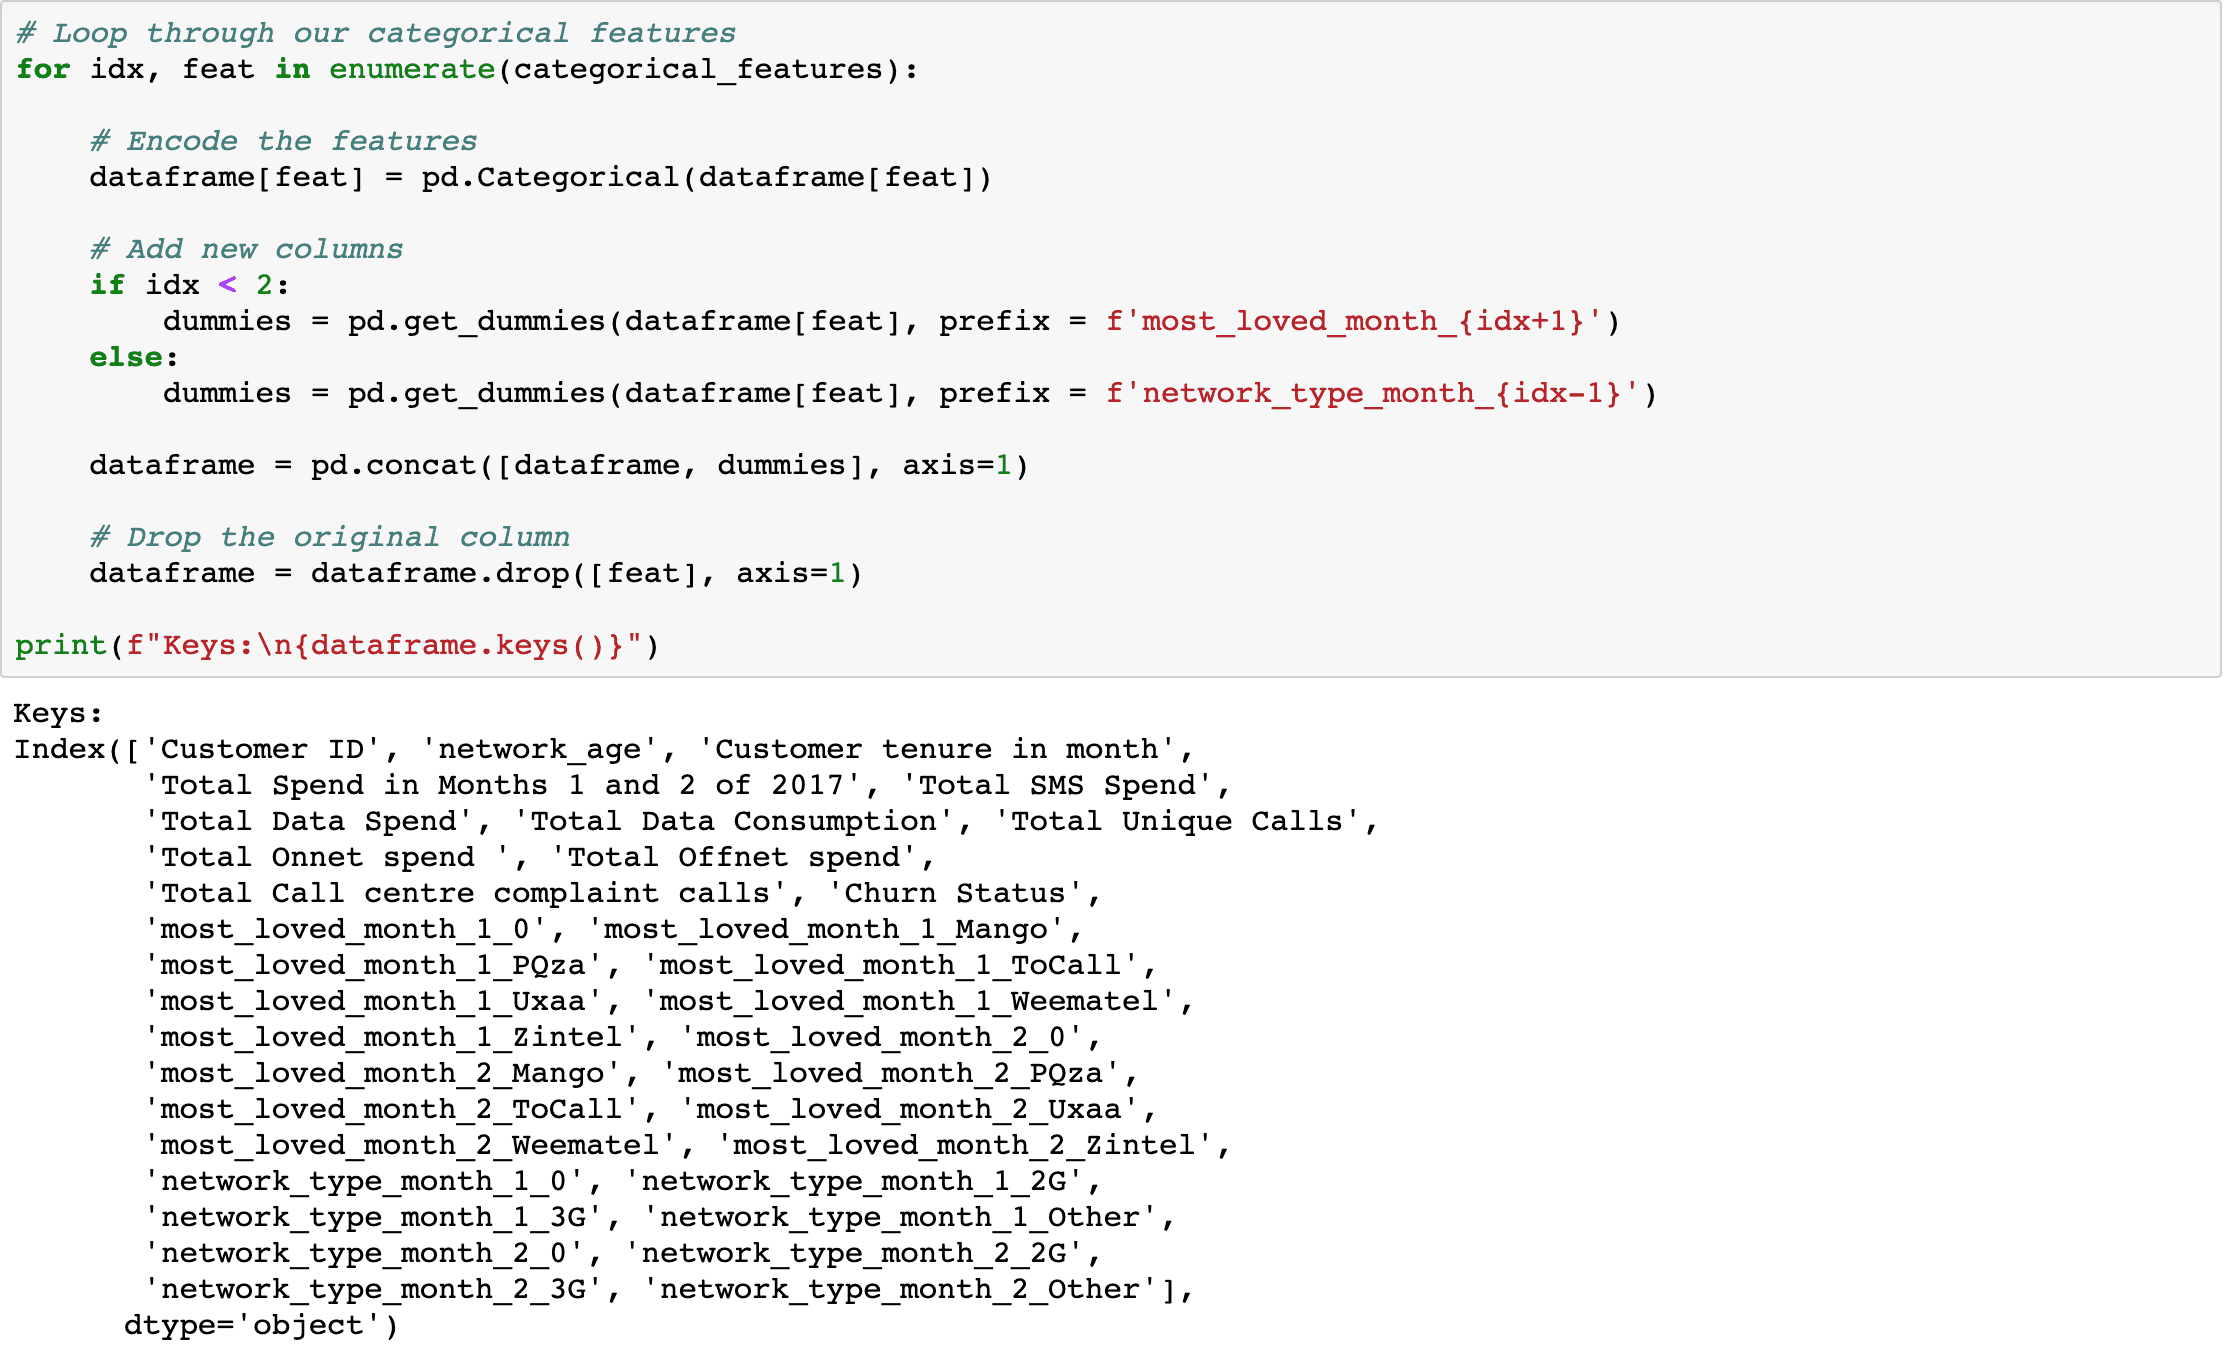
Our categorical features have now been removed:
Network type subscription in Month 1
Network type subscription in Month 2
Most Loved Competitor network in in Month 1
Most Loved Competitor network in in Month 2
And our encoded features have been added:
most_loved_month_1_0
most_loved_month_1_Mango
most_loved_month_1_PQza
most_loved_month_1_ToCall
most_loved_month_1_Uxaa
most_loved_month_1_Weematel
most_loved_month_1_Zintel
most_loved_month_2_Mango
most_loved_month_2_PQza
most_loved_month_2_ToCall
most_loved_month_2_Uxaa
most_loved_month_2_Weematel
most_loved_month_2_Zintel
network_type_month_1_2G
network_type_month_1_3G
network_type_month_1_Other
network_type_month_2_2G
network_type_month_2_3G
network_type_month_2_Other
Putting it together
Here is the full code for loading and preprocessing.
Machine Learning
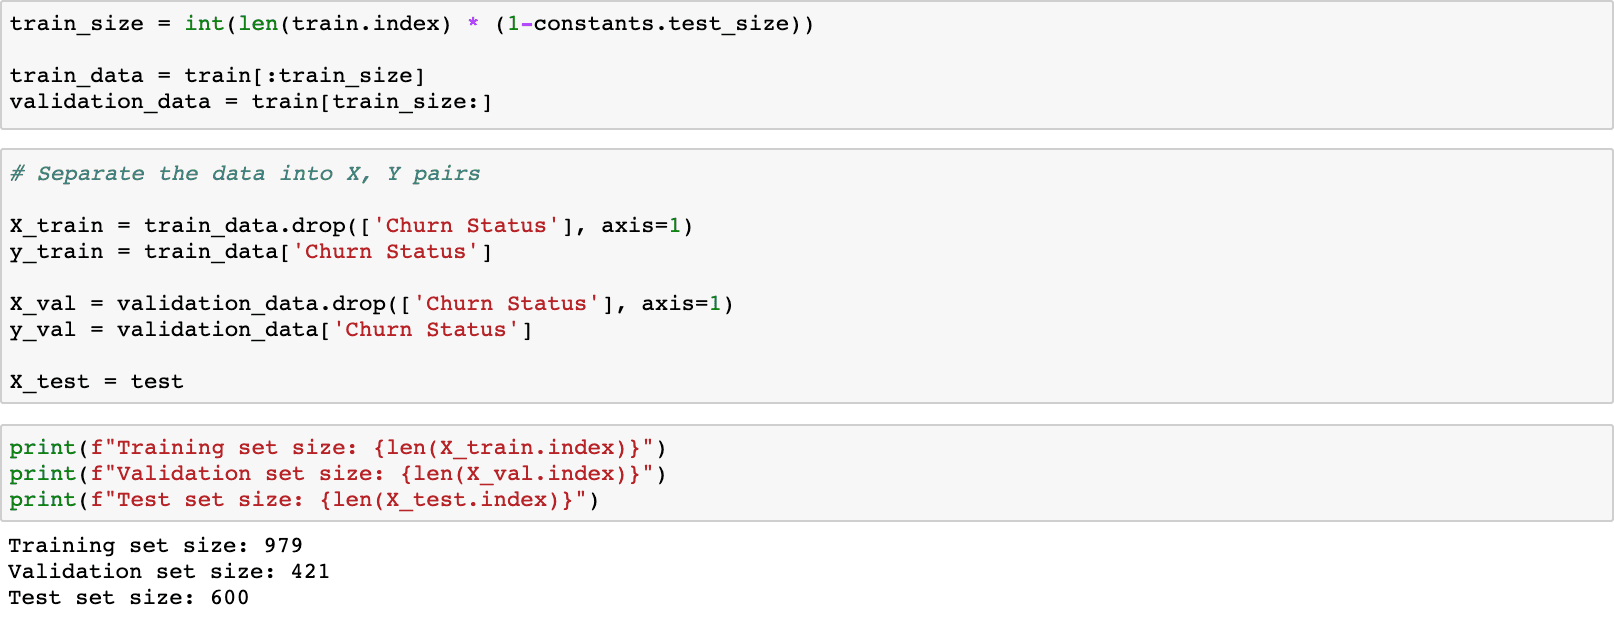
We next need to split our data into X, Y pairs (input, expected output) and use some of this data for training and some for validation. The validation set is used to ensure that we don’t overfit the training set. We also have the test set provided from the Kaggle competition.
XGBoost, or eXtreme Gradient Boosting will generate many weak-learning decision trees and ensemble the predictions together for the final output.
Train / Validation / Test split
We split the data into the Train/Validation/Test sets and also split the Train and Validation sets into X, Y pairs.
Model the Data
Next we create our XGBoost classifier. By printing our model, we can view all of the model’s hyperparameters. These are the knobs and levers we use to configure our model. These are not learnable parameters.
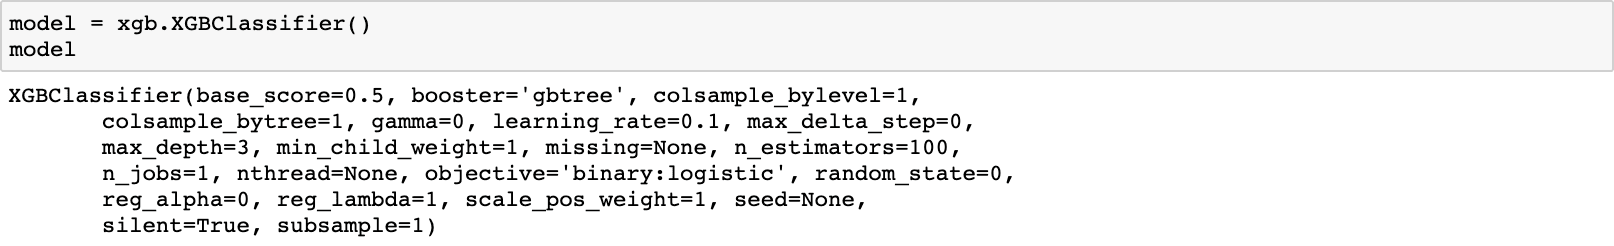
We can change any hyperparameters in the models constructor. For now, we will just use the default parameters.
Next, we pass in our X and Y values for our training set into XGBoost. Passing the data into the .fit() function, we train the model to learn the best set of parameters to model, or “fit,” this data.
Evaluation
We evaluate our model by checking the performance on the training and validation set.

XGBoost also tells us about “feature importances,” or which features are important factors in determining whether a customer will churn. Let’s take a look at the top 3 important features.
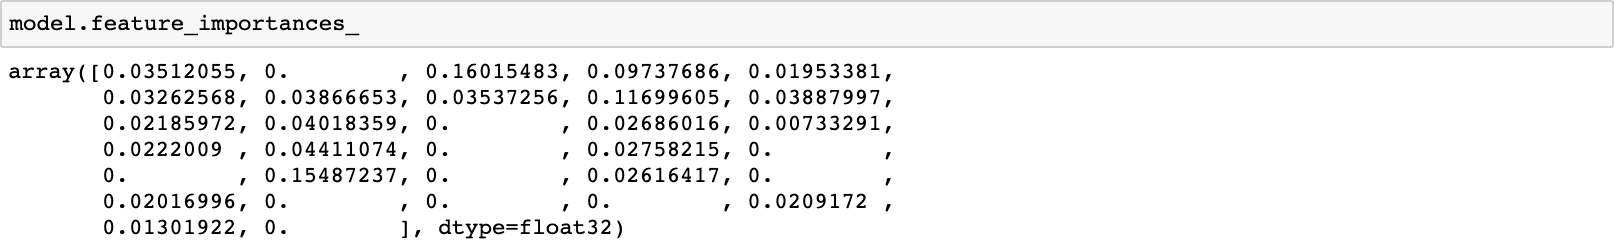
We find that the 3 most important features are the 2nd, 21st, and 8th feature which are as follows:
Total Spend in Months 1 and 2 of 2017
Most Loved Competitor network in Month 2
Total Offnet spend
These are the top 3 predictors on whether people are going to stay or leave. We can use these to be proactive and help prevent customer churn in the future.
Results
We can now use our machine learning model to predict if the Nigerian customer in the Kaggle dataset left or not.
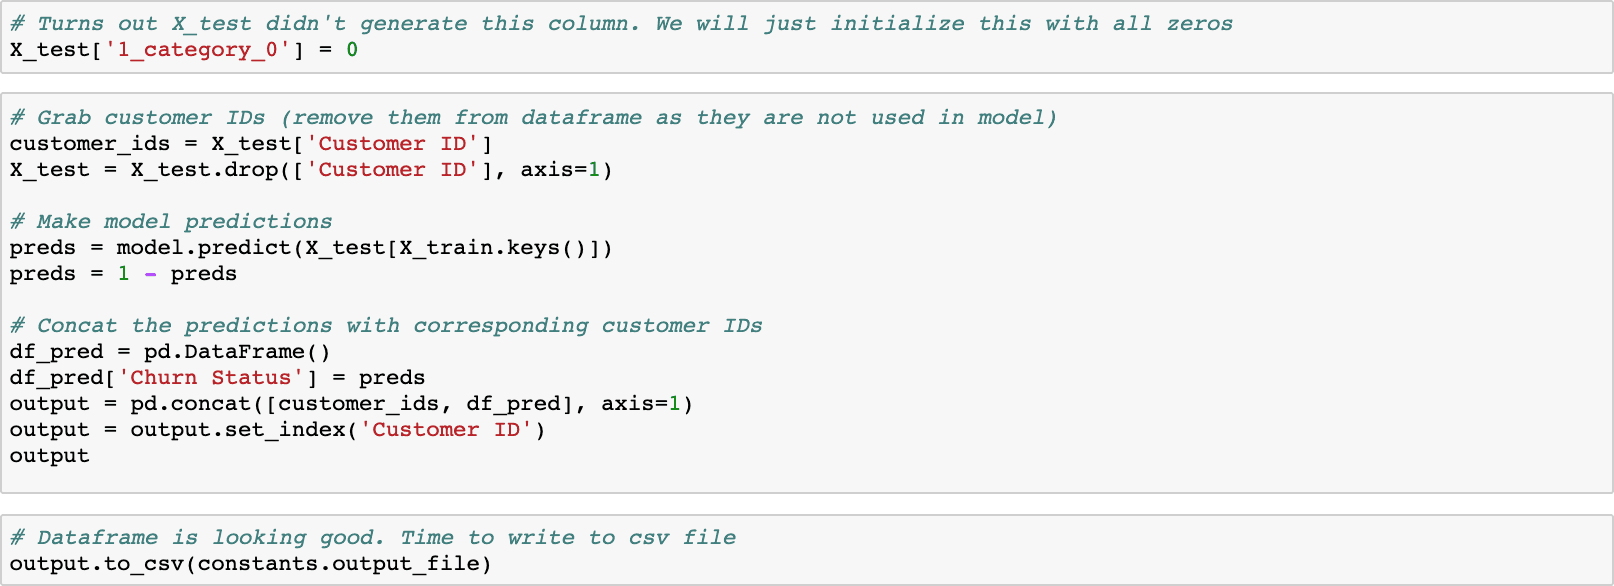
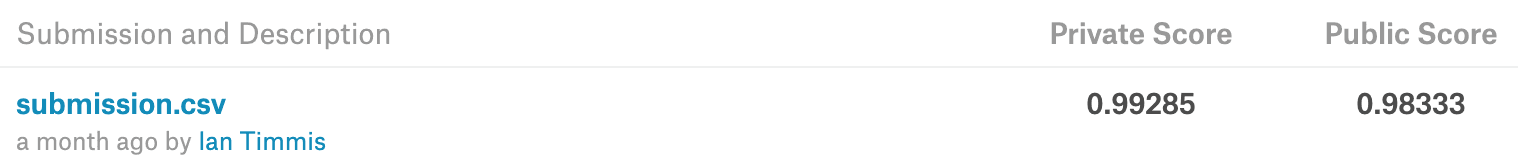
After we submit the results to Kaggle we can see our results are very accurate with over 99% accuracy on the private data set.
We also know that Nigerian Telecom need to start an outbound call campaign or some other marketing effort when there’s a drop in the customer’s total spend, a change in their most loved competitor and a drop in their total offnet spend. Otherwise there is a high risk of the customer leaving and then having to pass them off to the winback team.
